

- An online experiment is a method used by businesses to improve their
website, marketing, and business operations
- In general, analysing online experiments has been only done by
specialists and very large companies with internal data science
teams.
- Scientific Microservices has recently launched the ABSynthesis
endpoint, which unlocks this technology for developers that want to
provide the method to their users.
- This article shows how ABSynthesis is used to analyse a set of
experiments on a product page
- We show that ABSynthesis captures more profit faster than no experimentation, or using the calculations provided by Big Tech experiment tools.
What is experimentation?
Comparing two things against each other to understand them better is an age-old practice. In 1591, Galileo dropped two balls off the leaning Tower of Pisa to prove that gravity was a constant in one of the earliest recorded examples of experimentation in practice. Back then, the result (the balls landed at the same time) was strong enough to change the entire way people understood the world, to the point he was eventually accused of heresy by the Church. Four hundred years later, big tech companies like Meta, Amazon, Google, Netflix, and many others have used this exact same approach to dominate the innovation landscape for decades.
This is the power of Science.
Until recently, it’s been only giant companies that can afford to run experimentation at scale. I was part of developing the tools for this wave of domination, co-writing a conference paper with colleagues that remain giants in the industry on how we democratized experimentation at Booking.com. Now, Scientific Microservices is unlocking this technology for everyone with the ABSynthesis API, enabling developers in every market to run experiments on their own products, or even deliver this incredible level of power to their users directly.
Why it’s important to use experiments to improve your business
Running an e-commerce company is stressful, expensive, and fraught with doubt. Everything about your product listing – the colour of the product image background, the title and description of the product, or even the shape and colour of the ‘buy’ button – can influence the overall experience of your customers, and the likelihood they’ll make a purchase. But how do you decide what’s best?
This is where data, and especially experimentation, comes in. Many people will simply guess what the best version of their company should look like. Others will try a bit harder, and copy high-selling designs from other sellers. Still more might run focus groups to get rich feedback. However, none of these options will teach you about the true ‘best’ page for your particular product and market – only analysis of an experiment on real site visitors can settle this question.
The ultimate result is that e-commerce business owners that actively experiment on their product listings and landing page make more money faster by discovering better site designs, save lost money in useless ads, and learn more about about their market so they can stay relevant and understand how to grow.
Using ABSynthesis to determine the ultimate product page
To demonstrate exactly how these benefits can impact e-commerce owners, I have set up a scenario similar to what I’ve heard owners discuss.
Let’s call our example company SynthCorp. SynthCorp is already well established, and is selling sport clothing on a Shopify store. The store sees around 5000 – 10000 visitors a week to each product page (if you don’t have this much traffic on your site yet, don’t worry! You can still run experiments, but each one will take longer). About 2% of visitors will buy any given product they look at.
The scenario: Experiments on a product page
SynthCorp has just launched a new product, but the product page has been put together very quickly:
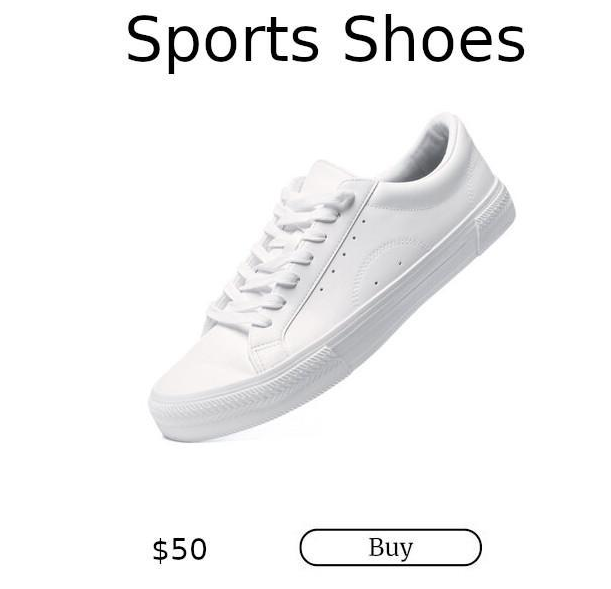
After much discussion, the product team decides on three elements of the page to experiment on – the product image, the product title, and the buy button.
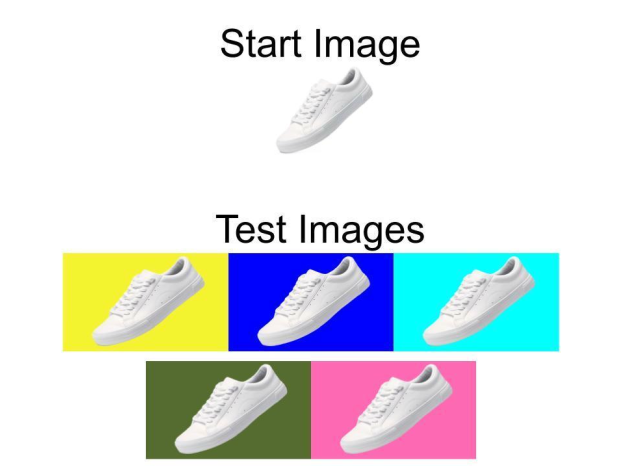
Image colour
For the product image the team runs five tests on the background color of the product image, comparing against a white background:
Product title
To test the impact of changing the product title, the team runs 9 experiments going from very basic to completely unhinged, comparing against the title ‘Sports Shoes’:
- Shoes
- Tennis shoes
- Modern Sports Shoes
- Basic Street Shoes
- Stylish Street Shoes
- Modern Tennis Shoes COMFORTABLE
- Tennis Sport Modern Excellent Shoe
- OMG AMAZING!!!! Excellent Modern Fashionable Show Very Comfortable
Real Leather
- BEST SHOES! COMFORTABLE! Sport Tennis Modern Stylish Street Shoes Skating Shoes Laces Real Leather MAGIC Jump High Run
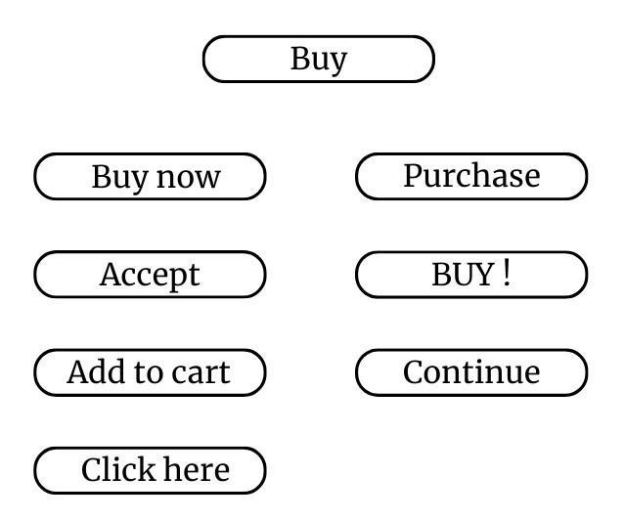
Buy button experiments
In this scenario the team can’t decide whether the color or the text of the button is more important, so they run two sets of tests on each element. They run 7 tests on different wording for the button, comparing against the word ‘Buy’:
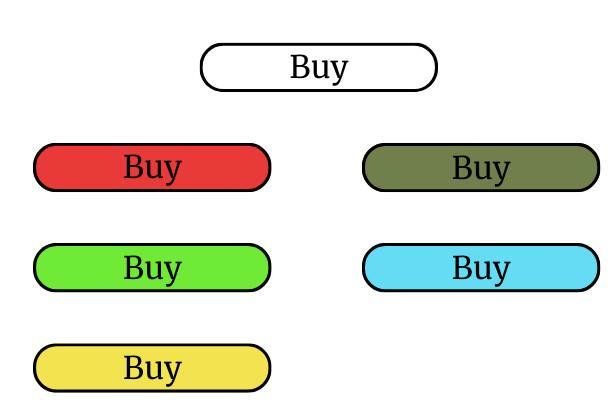
And 5 tests on the background color of the button, comparing against a white background:
Analysing the tests
Based on the full set of results, the final versions of the product page would look like this:
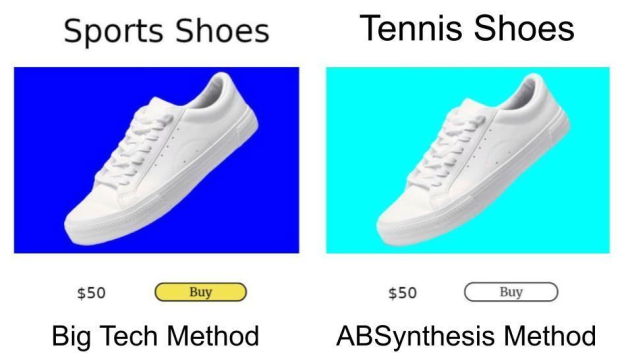
We can see here that the version on the left has changed the color of the button, both versions have changed the color of the image background (to different colors though!), and the version on the right has changed the title. You may prefer one or the other aesthetically, but what matters is what gets the most clicks!
Author’s note: In this case I know that the one on the right will get more clicks, because it’s based on the data I invented for this article. I told the computer changing the title should cause 0.5% uplift, while changing image background should cause 1% uplift. These differences are intentionally small to reflect what we see in the market.
ABSynthesis makes more money
Examining our final uplift, we can see some interesting outcomes:
##                Approach Total income
##                  <char>        <num>
## 1:           No changes     82000.00
## 2: Big Tech calculation     83236.10
## 3:          ABSynthesis     84934.57
If we only look at the time tests are being run, ABSynthesis made us $2934 more than making no changes, and $1698 more than the method offered by big tech companies! For an investment of under $1, that’s a good result! And (unlike traditional AB testing), we can expect to continue getting this return month on month!
The cool part is, if you’re an e-commerce business owner, you can try this out right now with your own data. We’ve built a demonstration app where we’ll do the analysis of your experiments for you – check it out here!
If you’re a developer, we’ve created an API you can use to enable your users to wield this power for themselves. We have a generous free tier, and the paid tier is currently 1c per call. You can get a key here.
If you want to learn more about ABSynthesis and the mathematics we use to calculate these numbers, check out the methods page , or jump on a call.