Compare marketing platforms

Choose the best ad provider for your product

A graph of cost per click over time with outliers highlighted in red

Introduction

There are a number of popular advertising platforms available to businesses, but not all products are suited to all platforms.

Run five experiments, each comparing an advertisement's performance on either platform A or B.


Add your user email and API key to your platform's secret manager.


import json
import requests
import os
import pandas as pd

api-key = os.environ['scimicro-api-key']
email = "user@scientificmicroservices.com"


install.packages(c('jsonlite', 'httr', 'data.table', 'ggplot2'))
library(jsonlite)
library(httr)
library(data.table)
library(ggplot2)

api-key <- Sys.getenv("scimicro-api-key")
email <- "user@scientificmicroservices.com"

The example data is five experiments that each saw relatively low traffic. The full dataset includes 1670 website visitors.

The dataset includes several unusually high-cost keywords.


I ran five experiments, please  arrange these as a json with one experiment per row.

In experiment 1 platform A got 50 visitors, and 10 clicked the ad, while Platform B got 70 visitors, and 15 clicked the ad.

In experiment 2 platform A got 60 visitors, and 15 clicked the ad, while Platform B got 80 visitors, and 25 clicked the ad.

In experiment 3 platform A got 80 visitors, and 30 clicked the ad, while Platform B got 90 visitors, and 65 clicked the ad.

In experiment 4 platform A got 90 visitors, and 50 clicked the ad, while Platform B got 150 visitors, and 90 clicked the ad.

In experiment 5 platform A got 500 visitors, and 100 clicked the ad, while Platform B got 500 visitors, and 200 clicked the ad.

successes_base = [10, 15, 30, 50, 100]
trials_base = [50, 60, 80, 90, 500]
sucesses_variant = [15, 25, 65, 90, 200]
trials_variant = [70, 80, 90, 150, 500]

mydata = [
    {
        "successes_base": sb,
        "trials_base": tb,
        "sucesses_variant": sv,
        "trials_variant": tv
    }
    for sb, tb, sv, tv in zip(successes_base, trials_base, sucesses_variant, trials_variant)
]


mydata <- data.frame(
    "successes_base"= c(10 , 15 , 30 , 50 , 100),
    "trials_base" = c(50 , 60 , 80 , 90 , 500),
    "sucesses_variant" = c(15 , 25,  65,  90, 200),
    "trials_variant" = c(70 , 80 , 90 ,150, 500))

Determine best platform

Use SciMi ABSynthesis to determine exactly how much better ads perform when posted on platform B as opposed to platform A.

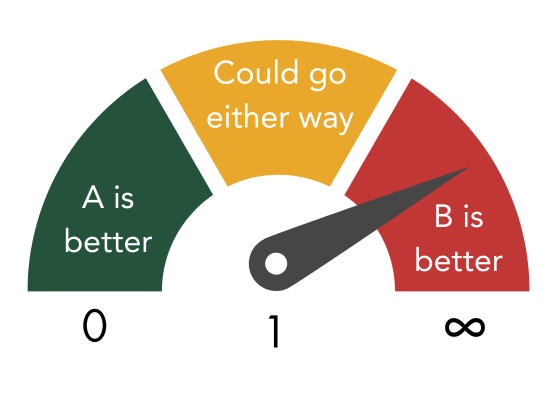
ABSynthesis returns an uplift value and a p-value.

A positive uplift indicates platform B performed better than platform A.

A low p-value (less than 0.05) indicates that the uplift value can be trusted.


Use the ABSynthesis endpoint at api.scientificmicroservices.com to analyse the dataset. Give the user email and key in the header with the titles 'email' and 'key'.


url = "https://api.scientificmicroservices.com/absynthesis"

headers = {
    'email': YOUR_EMAIL,
    'key': YOUR_KEY,
    'Content-Type': 'application/json'
}

response = requests.post(url_outliers, headers=headers, json=mydata)
uplift = response.json()
print(uplift)


url <- "https://api.scientificmicroservices.com/absynthesis"

response <- POST(
  url = url, 
  add_headers(  'email'= email,
                'key' = api-key,
                'Content-Type' = 'application/json'
  ),
  body = toJSON(mydata),
  encode = "json"
)

uplift <- fromJSON(content(response, as = 'text'))
print(uplift)

Take action

ABSynthesis found that platform B performed 38% better than platform A for the ads considered, and that this uplift can be trusted as the p-value is 0.0031 - much less than 0.05

Recommended action: Run more ads on platform B and massively reduce ad spend on platform A.

A graph of cost per click over time with outliers highlighted in red

Summary

DetectOutliers found an increasing pattern of outliers within a short time, indicating unusual or suspicious network traffic.

Recommended action: Further investigation of the outlier time periods to identify potential security threats or system faults.