Protect advanced machinery

Service machines in time by detecting unsual machine temperatures earlier.

A histogram of machine temperatures with the dangerous ones highlighted in red.

Introduction

Irregularities in machine sensor data can indicate defects in the machinery.

Detect outliers to prevent equipment failure, improve maintenance efficiency, or improve onsite safety.

Add your user email and API key to your platform's secret manager.

import json
import requests
import os
import pandas as pd

api-key = os.environ['scimicro-api-key']
email = "user@scientificmicroservices.com"

install.packages(c('jsonlite', 'httr', 'data.table', 'ggplot2'))
library(jsonlite)
library(httr)
library(data.table)
library(ggplot2)

api-key <- Sys.getenv("scimicro-api-key")
email <- "user@scientificmicroservices.com"

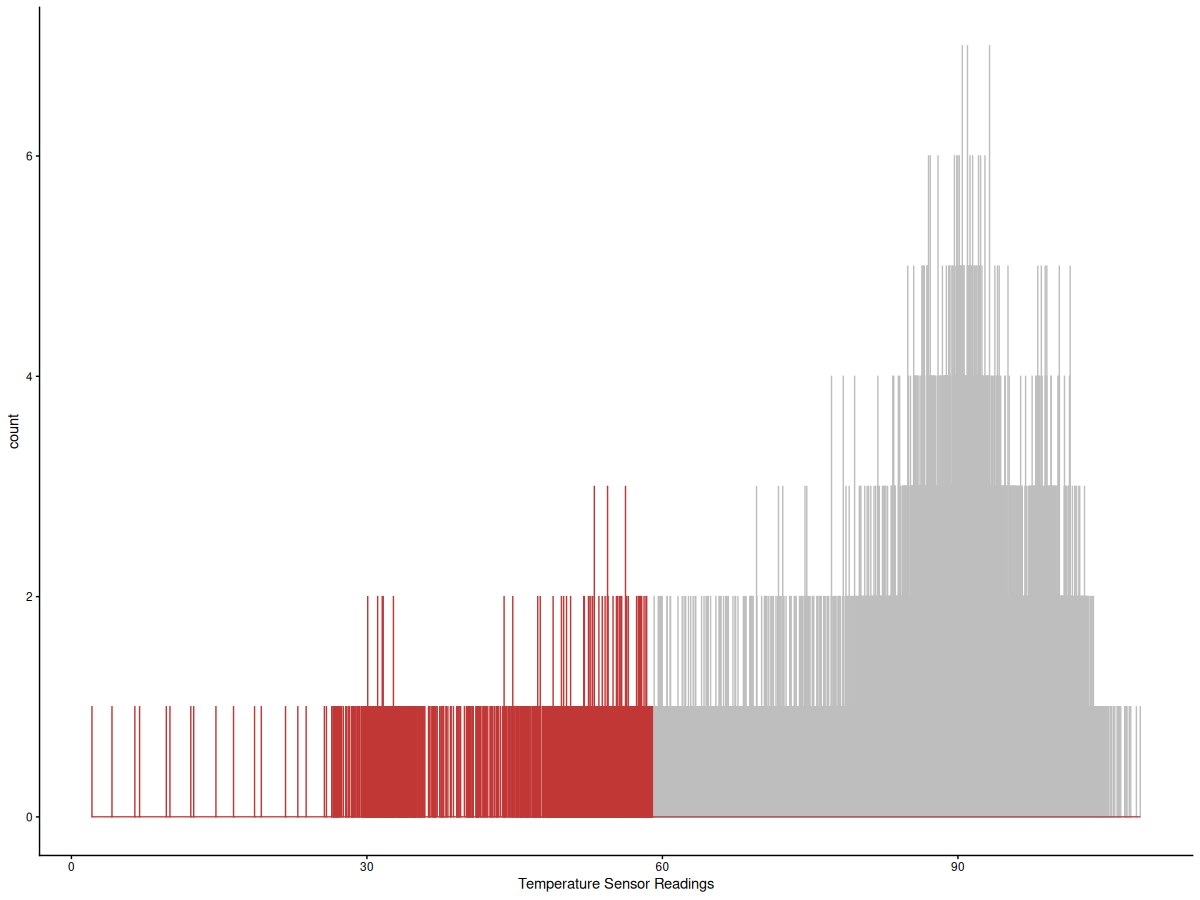
The example data is 22,695 temperature sensor readings from an internal component of a large industrial machine, sourced from the Numenta Anomaly Benchmark series.

The dataset includes a planned shutdown and a second unplanned anomaly leading directly to the third anomaly, a catastrophic failure of the machine.


Download the dataset at "https://raw.githubusercontent.com/numenta/NAB/refs/heads/master/data/realKnownCause/machine_temperature_system_failure.csv"


url = 'https://raw.githubusercontent.com/numenta/NAB/refs/heads/master/data/realKnownCause/machine_temperature_system_failure.csv'
res = requests.get(url, allow_redirects=True)
with open('machine_temps.csv','wb') as file:
    file.write(res.content)
machine_temps = pd.read_csv('machine_temps.csv')
print(machine_temps)


mydata <- fread('https://raw.githubusercontent.com/numenta/NAB/refs/heads/master/data/realKnownCause/machine_temperature_system_failure.csv')
head(mydata)

Detect unusual temperatures

Use SciMi DetectOutliers to monitor machine internal temperatures and instantly find shutdowns and potential risks of failure.

DetectOutliers sends a signal each time an anomaly is detected.


Use the DetectOutliers endpoint at api.scientificmicroservices.com to analyse the logs column of the dataset we downloaded. Give the user email and key in the header with the titles 'email' and 'key'.


url = "https://api.scientificmicroservices.com/detectoutliers"

headers = {
    'email': YOUR_EMAIL,
    'key': YOUR_KEY,
    'Content-Type': 'application/json'
}

data = machine_temps['temperature']
response = requests.post(url_outliers, headers=headers, json=data)
outliers = response.json()
print(outliers)


url <- "https://api.scientificmicroservices.com/detectoutliers"

response <- POST(
  url = url, 
  add_headers(  'email'= email,
                'key' = api-key,
                'Content-Type' = 'application/json'
  ),
  body = toJSON(mydata$logs),
  encode = "json"
)

outliers <- fromJSON(content(response, as = 'text'))
outliers[, position := position+1] # Indexing is 0 based, so R requrires adjustment 
print(outliers)

Take action

DetectOutliers found three sets of sensor readings with an unusually low temperature. Each set of increasingly frequent outlier temperatures provides an early warning of maintenance shutdown or catastrophic failure.

Recommended action: Investigate the causes of the temperature anomalies to avoid catastrophic failure of the machine.

A histogram of machine temperatures with the dangerous ones highlighted in red.

Summary

DetectOutliers found an increasing pattern of outliers on a minute-to-minute basis, demonstrating the imminent breakdown of the machine.

Using the API, the machine can be shut down and serviced before irreparable damage occurs.