Detect bot traffic

Detect changes in response times to detect threats early

A laptop on top of an atom with symbols of different science disciplines around it.

Introduction

Deviations from normal server behavior could indicate potential security threats

Detect outliers in server latency to improve system observability and monitor performance in real time

Add your user email and API key to your platform's secret manager.
import json
import requests
import os
import pandas as pd

api-key = os.environ['scimicro-api-key']
email = "user@scientificmicroservices.com"

install.packages(c('jsonlite', 'httr', 'data.table', 'ggplot2'))
library(jsonlite)
library(httr)
library(data.table)
library(ggplot2)

api-key <- Sys.getenv("scimicro-api-key")
email <- "user@scientificmicroservices.com"

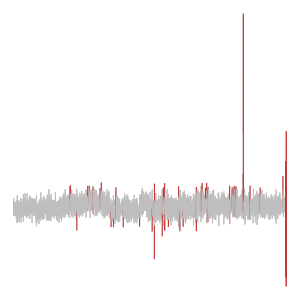
The example data is 4,032 CPU usage records from a server in Amazon’s East Coast datacenter, sourced from the Numenta Anomaly Benchmark series.

The dataset ends with complete system failure resulting from a documented failure of AWS servers.


Download the dataset at "https://raw.githubusercontent.com/numenta/NAB/refs/heads/master/data/realKnownCause/ec2_request_latency_system_failure.csv"


url = 'https://raw.githubusercontent.com/numenta/NAB/refs/heads/master/data/realKnownCause/ec2_request_latency_system_failure.csv'
res = requests.get(url, allow_redirects=True)
with open('machine_temps.csv','wb') as file:
    file.write(res.content)
machine_temps = pd.read_csv('machine_temps.csv')
print(machine_temps)


mydata <- fread('https://raw.githubusercontent.com/numenta/NAB/refs/heads/master/data/realKnownCause/ec2_request_latency_system_failure.csv')
head(mydata)

Monitor server response times

Use SciMi DetectOutliers to monitor the performance of the servers and instantly find unusual patterns in server logs.

DetectOutliers sends a signal each time an anomaly is detected.


Use the DetectOutliers endpoint at api.scientificmicroservices.com to analyse the logs column of the dataset we downloaded. Give the user email and key in the header with the titles 'email' and 'key'.


url = "https://api.scientificmicroservices.com/detectoutliers"

headers = {
    'email': YOUR_EMAIL,
    'key': YOUR_KEY,
    'Content-Type': 'application/json'
}


url <- "https://api.scientificmicroservices.com/detectoutliers"

response <- POST(
  url = url, 
  add_headers(  'email'= email,
                'key' = api-key,
                'Content-Type' = 'application/json'
  ),
  body = toJSON(mydata$logs),
  encode = "json"
)

outliers <- fromJSON(content(response, as = 'text'))
outliers[, position := position+1] 
print(outliers)

Take action

DetectOutliers found an increasing pattern of outliers within a short time, indicating unusual or suspicious network traffic.

Recommended action: Further investigation of the outlier time periods to identify potential security threats or system faults

Summary

DetectOutliers found an increasing pattern of outliers within a short time, indicating unusual or suspicious network traffic.

Recommended action: Further investigation of the outlier time periods to identify potential security threats or system faults.